
Analysis and visualization of heart rate variability (HRV)
")
Introduction
Nowadays, a healthy, active lifestyle is more and more important to us. Many people use sports watches or fitness bands to plan their workouts. This type of devices usually collect data such as number of steps and heart rate. In the case of heart rate signal the accuracy of the data recorded from optical sensors is of key importance.
Conducted research include development of methods for preprocessing and analysis of heart rate signal recorded using of non-invasive techniques, as well as for the determination of time-frequency parameters. Another aspect concerns development of methods for visualization of patterns occurring in time series in relation to heart rate variability, which may carry important information about the patient's health.
Methods
A parameter often used by physicians to assess the patient's effort is the duration of the longest segment of the pulse signal above certain threshold. Artifacts present in the signal may cause unintentional shortening of such signal segment in case of automatic processing. In order to remove artifacts, moving average filter was proposed with a new approach to finding its windows length using zero-points of third gradient (jerk) of Sum of Absolute Differences method.
In the case of the heart rate variability signal analysis, artifacts in the form of peaks of high amplitudes and gaps introduced by data transmission errors have significant impact on the values of time and frequency parameters. A non-deterministic method of removing artifacts in the HRV signal was proposed, similar to the cubic interpolation algorithm inspired by the Kubios algorithm.
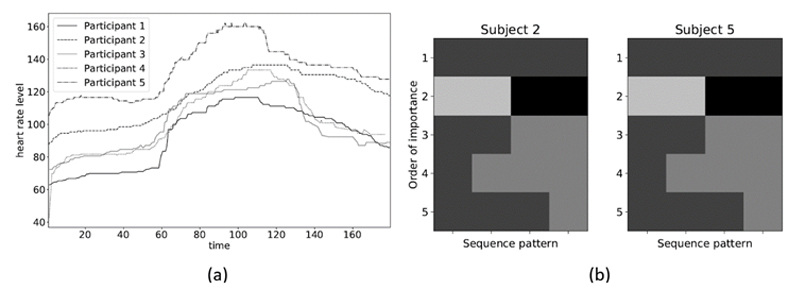
The visualization of time series often has a great influence on the interpretation of signals. A method for generating utility bitmaps using the grayscale intelligent icons was proposed. Bitmaps are created on the basis of determined utility values of the sub-series of the analyzed signal.
Results
The algorithms were validated using the following data sets: PAMAP2 Physical Activity Monitoring Data Set (open database of UCI Machine Learning Repository), PysioNet Simultaneous Physiological Measurements database and data collected from participants of the North Sea Race (cycling race) as part of the North Sea Race Endurance Exercise Study project (NEEDED ). The results are shown in Figures 2-4.
Fig. 1 shows the results of the SAD-based algorithm. It enables correct determination of the segment of the heart rate signal above the threshold of 105bpm, which is used as the threshold for the 1st degree physical effort.
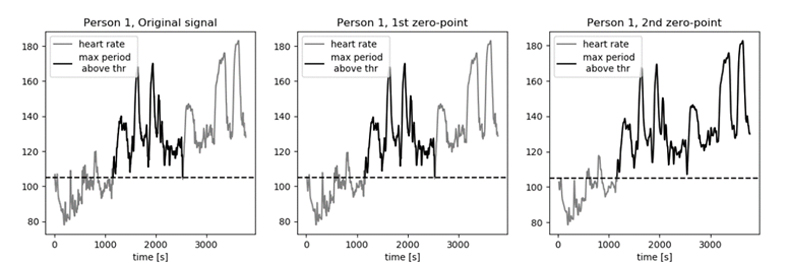
Fig. 2 shows the results of the application of the gap removal algorithm in the HRV signal. It can be observed that the generated curve is very close to the original signal, in contrast to the curve generated by the cubic spline interpolation method. At the same time, the results indicate that the proposed method of artifact removal does not significantly affect the values of time-frequency parameters, in contrary to averaging or threshold-based methods.
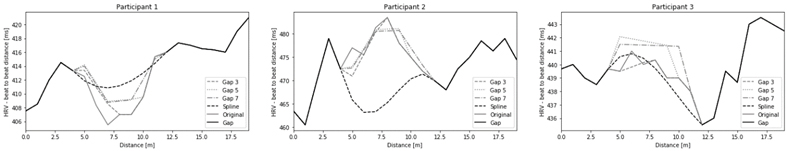
Fig. 3b shows examples of utility bitmaps generated for persons 2 and 5, whose heart rate variability signal is plotted in Fig. 3a.
Conclusions
The effective methods of filtering the heart rate and HRV signals, as well as artifact removal algorithms were developed. Moreover, methods of visualization of utility patterns in time series applied to HRV signals were also proposed.
Contact
- Dr. Aleksandra Królak
 , e-mail: This email address is being protected from spambots. You need JavaScript enabled to view it.
- Dr. Aleksandra Królak
Publication
- T. Wiktorski, A. Królak: „Extended Approach to Sum of Absolute Differences Method for Improved Identification of Periods in Biomedical Time Series”, MethodsX, 2020-10, doi: 10.1016/j.mex.2020.101094.
- T. Wiktorski, A. Królak, K. Rosińska, P. Strumillo and J. C. Lin, "Visualization of Generic Utility of Sequential Patterns", IEEE Access, vol. 8, pp. 78004-78014, 2020, doi: 10.1109/ACCESS.2020.2989165.