Geometric modeling of blood vessels
Introduction
Cardiovascular diseases are the leading cause of death worldwide. Their prevention and treatment require accurate, noninvasive and personalized diagnostic techniques. At present, the leading technique is magnetic resonance (MR) tomography. It allows acquisition of three-dimensional images of blood filling the vessels and tissues, without use of contrast agents or X-ray radiation. Despite huge, still unexplored capabilities of this method, images accessible in clinics consist of elementary cuboids (voxels) of finite dimensions, e. g. 0,5x0,5x0,5 mm3. The intensity of each voxel is constant within its space, e. g. proportional to the amount of blood filling it. On the other hand, the diameter of the blood vessel branches takes values from a few centimeters for aorta (macroscopic scale) down to tens of micrometers for venules and arterioles (mesoscopic scale). The radius of most arteries and veins is comparable then to the length of voxel sides. This leads to the effect of voxelization – vessel regions are approximated by sets of cuboids (boxes). Smooth boundaries between the vessel and surrounding tissues take unnatural form of staircase surfaces. There is a need for development of algorithms for reconstruction of the original shape and dimensions of blood vessels for medical diagnosis, through numerical analysis of their severely distorted (due to the limited resolution) images. Moreover, the MR images feature random intensity fluctuations which are an additional source of uncertainty in finding the course of centerlines and measuring the diameter of vessels. The modeling algorithms should be robust to those (and other) distortions and noise, inherent to MR tomography. Comprehensive modelling of the processes of blood delivery to tissues has to account for the fact thin branches, of diameter smaller than the voxel side, are not visible in the image as separate regions, one can observe the net effect of their perfusion with blood only.
The project is aimed at development of mathematical description of the structure of blood vessels visualized in 3D magnetic resonance images. Such models offer objective, accurate geometrical information on the blood vessel trees and parameters of their branches – for detailed, personalized diagnosis of the circulatory system. They can be used for noninvasive simulation of blood flow, e. g. in critical regions such as stenoses and aneurysms. Geometric modeling allows for construction of vascular prostheses, e. g. via 3D printing, to restore patency of diseased branches.
- Methods
In the traditional approach to blood vessels modeling image segmentation is first applied, e. g. through intensity thresholding, to produce a binary image defined in points of voxels diagonals intersection – too sparse to represent the vessel walls location in the space between those points. Such segmentation does not account for information on local shape of the walls, on the course of centerlines and on intensity profiles in the space around the points of the digital image. Therefore, in this project, the segmentation was not applied to the image. Instead, continuous (analog) models representing key phenomena of the process of MR image formation were used. Parametric models of those phenomena were defined. By local tuning of the parameters, the models were fitted to image intensity spatial distribution. In this way, quantitative evaluation of significant geometric properties of blood vessels were obtained, in the analog space.
The algorithm developed for geometric modeling of blood vessel trees is illustrated in Fig. 1 (Materka 2015). The image of the tree is filtered using a multiscale Frangi “vesselness” filter, based on computation of Hessian at each point. The filter enhances elongated blood vessel objects and suppresses the background intensity. The result of filtering is thresholded, and then binary regions skeleton is found. In our method, segments between the tree bifurcations are approximated by a smooth (differentiable) function of 3 spatial coordinates. This allows computation of tangent vectors to the centerline and planes perpendicular to them – local cross-sections. In this way, azimuth and elevation angles are insensitive to random fluctuations and intensity jumps taking place in ToF images.
On the cross-section planes, an intensity profile model is fitted to take account of vessel edge blurring originating in MR signal averaging inside the voxel space and other effects, jointly representing the MR scanner “impulse response” or “point spread function”. The intensity profile along radial directions around the vessel centerline point (Fig. 2a) is continuous and given analytically (Materka 1991), (Materka 2015). The results of model fitting are local values of background intensity, intensity jump inside the vessel and the vessel radius.
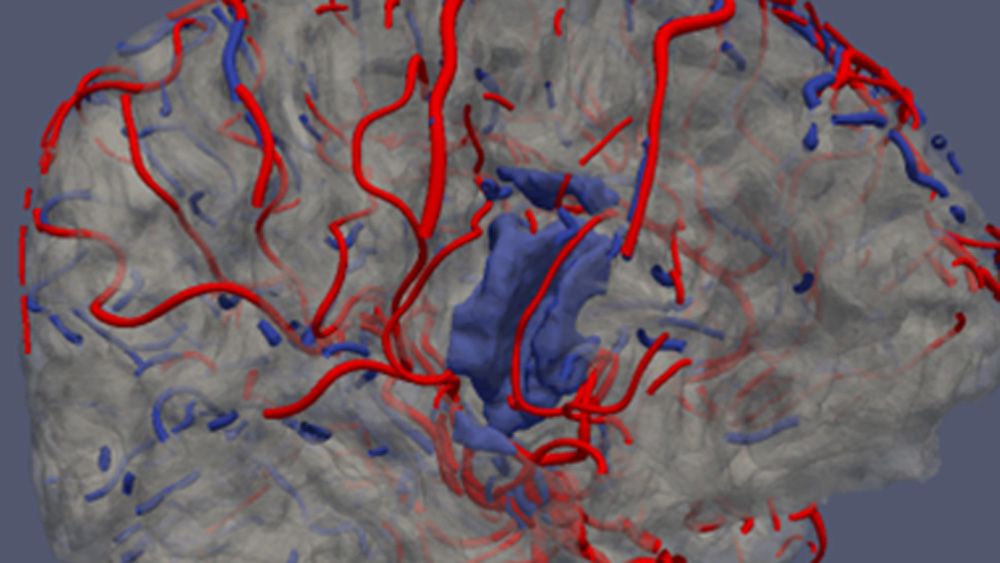
Vessel segments between bifurcations are described by sets of centerline points, each attributed a tangent vector and radius, Fig. 3a. This description allows easy approximation of the surface of the vessel walls by a triangular mesh, Fig. 3b. By applying these steps to all the vascular tree segments of the skeleton, one obtains the whole geometric model of the macroscopic part of the artery (ToF) and vein (QSM) trees visualized in the images, Fig. 3c.
The reconstructed segments of the vessel tree are coupled together via dedicated T-junctions to model the bifurcations, Fig. 3d, developed with the use of computer graphics techniques (Kociński 2016), Vinhais 2018). The assumption of circular vessel branch shape can be easily relaxed to move the nodes of the triangular mesh to the actual vessel tree surface, with a small number of iterative refinements (Vinhais 2018).
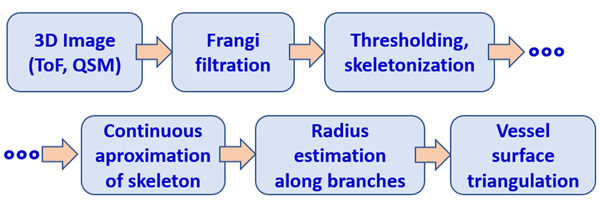
Fig. 1. Developed algorithm of geometric modelin of blood vessels. ToF: time of flight angiography; QSM: quantitative susceptibility imaging, MR technique for veins imaging.
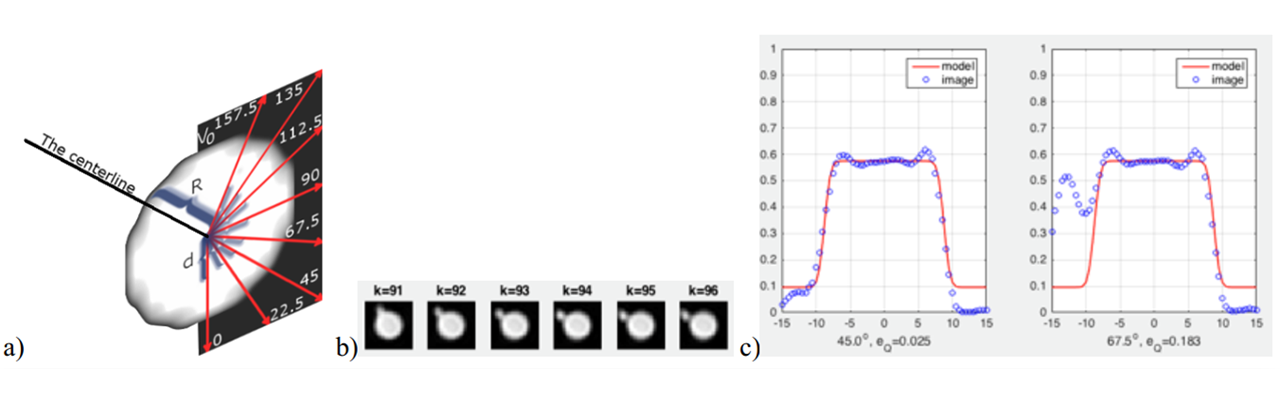
Fig. 2. a) Radial directions on a vessel cross-section plane for intensity profile fitting, b) example of consecutive cross-sections of a vessel featuring thin bifurcating branch, c) results of fitting the profile along 45° and 67.5° directions, for cross-section #95 (one can notice a trace of the bifurcating branch on the rightmost plot at 67.5°; the robust model does not react to its presence).
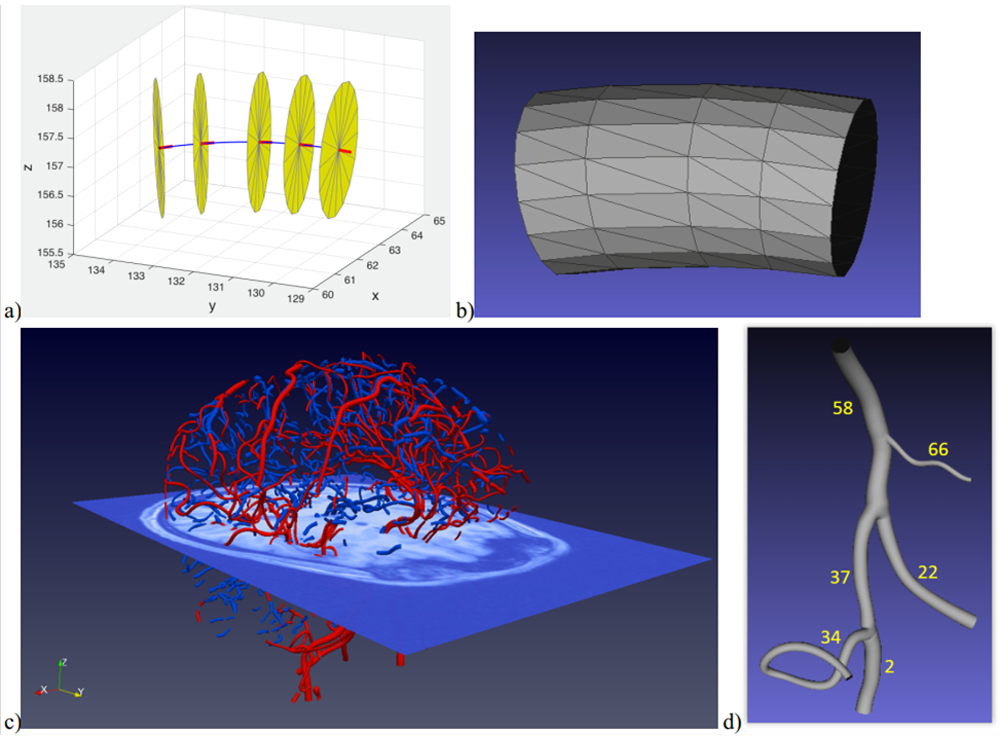
Fig. 3. a) Illustration of the elements of the vessel segment model (centerline in blue, tangent vectors in red, circular cross-sections in yellow), b) triangular mesh modeling the inner walls of the segment, c) arterial tree branches extracted from brain ToF image (in red) and venous branches from QSM (in blue), d) geometric model of example branches #58, #66, #37, #34, #2 and #22, connected together with “waterproof” T-junctions.
- Results
The developed geometric model are “waterproof”. This allows manufacture of physical models of the vessel tree (e. g. plastic material phantoms), compatible with magnetic resonance scanners. Such phantoms have been designed on the basis of selected arterial branches of a real brain and manufactured with a 3D printer, Fig. 4a (Kociński 2017a). The printed phantoms were submerged in water, placed inside an MR clinical scanner bore to acquire T2-weighted images of typical, low resolution. After some preprocessing of the images, the algorithm of Fig. 1 was applied to them. The geometric model of the connected branches was identified and compared with the original, Fig. 4 b d. An excellent agreement in terms of the branches shape and vessel radius was observed.
In (Klepaczko 2015) a computer simulator of the MR scanner (Klepaczko 2014) was used to generate phase contrast angiography (PCA) images of a geometric phantom of a carotid artery, Fig. 5a. The intensity of PCA images is an approximation to the magnitude of local velocity vector of blood cells. The fitted intensity profile model was a parabolic function (under the assumption of laminar flow).
A computer program was developed to adapt the Karch algorithm to simulate the growth of vessel trees in the mezoscopic scale (arterioles and venules). The simulated trees were connected to the macroscopic-scale branches, to mimic the supply of the neighboring cortex regions with blood, Fig. 6b. The surface of the cortex (gray matter) was approximated with a triangular mesh based on segmented T2-weighted image, acquired for the same subject, Fig. 6a.
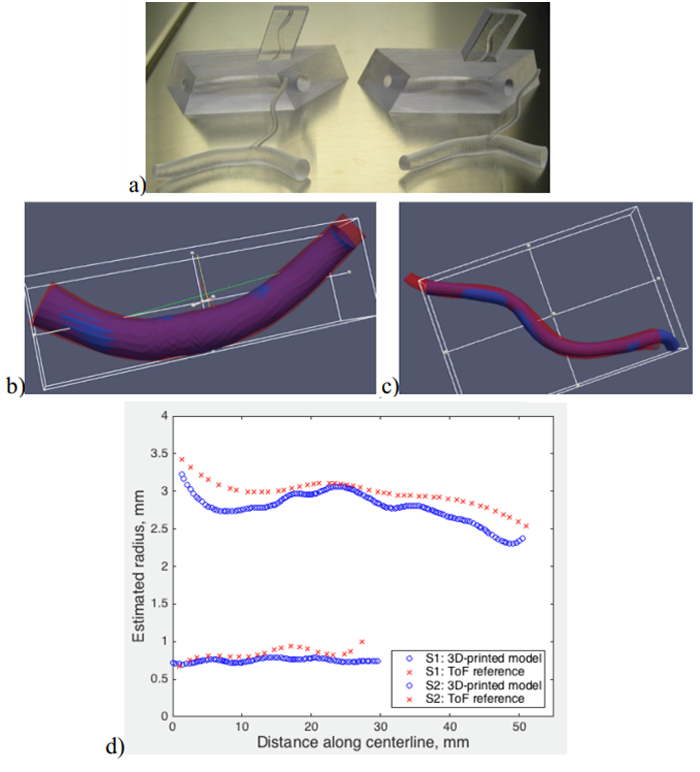
Fig. 4. a) A photography of a few 3D printed phantom versions manufactured on the basis of the model of real vessels extracted from a ToF image, b) wall surface of the thicker branch, c) the surface of the thinner branch, d) radius estimated along the centerline (red - model extracted from brain ToF image, blue – 3D printed model).
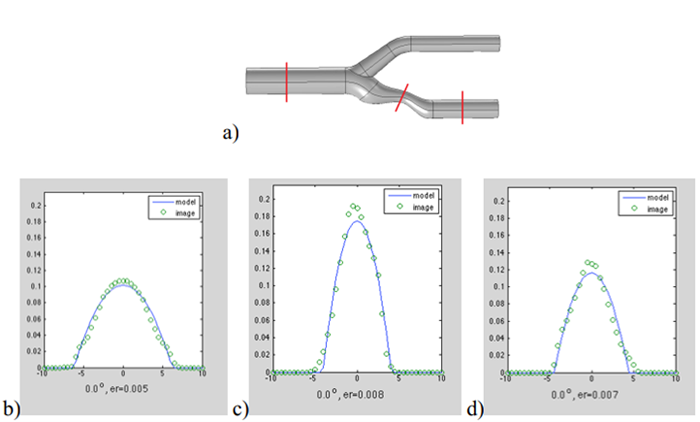
Fig. 5. a) Visualization of a digital phantom of carotid artery with stenosis; b), c), d) blood velocity profile fitted to cross-sections marked in red on a), from left to right.

Fig. 6. a) Model of arterial (in red) and venous (in blue) branches superimposed on the surface of brain gray matter (in gray); b) selected region of brain cortex (light blue) connected via Karch-algorithm-synthesized thin arteriole trees with an artery located within the region fissure; c) A photomicrograph of corrosive model of microscopic brain blood vessels (A. Rodrigez-Baeza and M. Ortega-Sanchez, Portrets of the Mind, 2010, pp. 216-217, reproduced with kind permission of the authors).
- Conclusions
Thanks to approximation of a number of consecutive vessel skeleton points with a differentiable function, the estimation of centerline tangent vectors, and thus the definition of perpendicular cross-sections, is much more accurate than in the case of original Frangi method (Blumenfeld 2015), (Materka 2015).
The use of analytical continuous model of image blur allows estimation of the vessel diameter with the accuracy greater than the voxel sides (subvoxel accuracy). The plot shown in Fig. 4d was obtained for 0,5x0,5x0,5 mm3 voxel-size ToF image for the arteries and 0,33x0,33x2,2 mm3 voxel-size T2 image for the plastic phantom.
Local fitting of the image blur model in each skeleton point makes the radius estimation practically insensitive to image intensity and contrast nonuniformities (Blumenfeld 2015), (Materka 2015).
The computation time needed for fitting the models for all macro-scale brain vessels (Fig. 3c) is about 15 minutes (Intel i7, 16 GB, 2.2 GHz), compared to 10 hours of image segmentation via level-set technique. The algorithm runs automatically – there is no need for manual marking of the vessel endpoints, as it is in the case e. g. of the popular Vascular Modeling Toolkit (VMTK) package implementing the LS method (Klepaczko 2016). Moreover, LS segmentation is much more sensitive to noise and intensity jumps (Materka 2015). This sensitivity can be reduced (Woźniak 2016); however, binarization still puts a limits on accuracy of geometric modeling, and the implicit spatial function of their walls surface does not provide information about the vessel tree structure and topological relations between its branches.
The developed model of intensity profile inside vessels can have a form different to the one shown in Fig. 2c, adequately to physical phenomena that take place in the process of image formation. A parabolic-function model, fitted to PCA images serves estimation of the local radius and, at the same time, the blood velocity distribution inside the vessel lumen, Fig. 5. Results of this kind are not available from the LS approach. They were confirmed with the use of real-life PCA MRI of physical radiological phantoms under the controlled flow of a liquid with haemodynamic properties resembling the blood (Klepaczko 2014), (Materka 2015).
AS illustrated in Fig. 6a, location of arteries and brain cortex surface can be reconstructed with high accuracy, respectively from ToF and T2-weighted images. This accuracy allows specification of the geometric conditions for the growth of arteriole trees. For the algorithmic connection of both trees (Fig. 6b), literature data were used (average blood pressure in capillaries, average radius of thin vessels in the cortex). Visually, one can confirm similarity of the connected macro- and mesoscale models to the microphotography of real-life vessels, Fig. 6c. Full, personalized control of the growth of arteriole trees requires additional, locally averaged image information on perfusion and matter exchange in tissues. This information was not available at the time of the project realization; it is likely it will be in future, as the result of progress in MR imaging.
They are realistic possibilities of further improvements in the modeling method and increase of its accuracy, with the use of deep learning algorithms (Jurek 2020).
- Contact
- Prof. Andrzej Materka
 , e-mail: This email address is being protected from spambots. You need JavaScript enabled to view it.
- Dr. Marek Kociński , e-mail: This email address is being protected from spambots. You need JavaScript enabled to view it.
- Prof. Andrzej Materka
- Publication
- (Blumenfeld 2015) J. Blumenfeld, M. Kociński, A. Materka, A centerline-based algorithm for estimation of blood vessels radii from 3D raster images, IEEE Signal Processing, Algorithms, Arrangements and Applications (SPA), 2015, pp. 38-43, Poznań, DOI: 10.1109/SPA.2015.7365110.
- (Jurek 2020) J. Jurek, M. Kociński, A. Materka, M. Elgalal, A. Majos, CNN-based superresolution reconstruction of 3D MR images using thick-slice scans, Biocybernetics and Biomedical Engineering 40(1), 2020, pp. 111-125, https://doi.org/10.1016/j.bbe.2019.10.003.
- (Klepaczko 2014) A. Klepaczko, P. M. Szczypiński, G. Dwojakowski, M. Strzelecki, A. Materka, Computer Simulation of Magnetic Resonance Angiography Imaging: Model Description and Validation, PLOS ONE 9(4):e93689 , 2014, pp. 1-15, DOI: 10.1371/journal.pone.0093689.
- (Klepaczko 2015) A. Klepaczko, A. Materka, P. M. Szczypiński, M. Strzelecki, Numerical Modeling of MR Angiography for Quantitative Validation of Image-Driven Assessment of Carotid Stenosis, IEEE Transactions on Nuclear Science 62(3), 2015, pp. 619-627, DOI: 10.1109/TNS.2015.2433925.
- (Klepaczko 2016) A. Klepaczko, P. M. Szczypiński, A. Deistung, J. R. Reichenbach, A. Materka, Simulation of MR angiography imaging for validation of cerebral arteries segmentation algorithms, Computer Methods and Programs in Biomedicine 137, 2016, pp. 619-627, http://dx.doi.org/10.1016/j.cmpb.2016.09.020.
- (Kociński 2016) M. Kociński, A. Materka, A. Deistung, J. R. Reichenbach, Centerline-based surface modeling of blood-vessel trees in cerebral 3D MRA, IEEE Signal Processing Algorithms, Architectures, Arrangements, and Applications - SPA 2016, pp. 85-90, Poznań, DOI: 10.1109/SPA.2016.7763592.
- (Kociński 2017a) M. Kociński, A. Materka, M. Elgalal, A. Majos, On accuracy of personalized 3D-printed MRI-based models of brain arteries, 2017 International Conference on Systems, Signals and Image Processing (IWSSIP), Poznań, DOI: 10.1109/IWSSIP.2017.7965601.
- (Kociński 2017b) M. Kociński, A. Materka, A. Deistung, J. R. Reichenbach, A. Lundervold, Towards multi-scale personalized modeling of brain vasculature based on magnetic resonance image processing, IEEE 24th International Conference on Systems, Signals and Image Processing, Poznań, DOI: 10.1109/IWSSIP.2017.7965604.
- (Materka 1991) A. Materka, Metody pomiaru wybranych cech geometrycznych sceny 3W, w Elementy cyfrowego przetwarzania i analizy obrazów, A. Materka (Ed.), Ch. 2., PWN 1991, https://www.researchgate.net/publication/301326880_Elementy_cyfrowego_przetwarzania_i_analizy_obrazow, ISBN 83-01-10566-6,
- (Materka 2015) A. Materka, M. Kociński, J. Blumenfeld, A. Deistung, B. Serres, J. R. Reichenbach, Automated Modeling of Tubular Blood Vessels in 3D MR Angiography Images, 9th International Symposium on Image and Signal Processing and Analysis (ISPA 2015), pp. 56-61, Zagreb, DOI: 10.1109/ISPA.2015.7306032.
- (Vinhais 2018) C. Vinhais, M. Kociński, A. Materka, Centerline-Radius Polygonal-Mesh Modeling of Bifurcated Blood Vessels in 3D Images using Conformal Mapping, 2018 Signal Processing: Algorithms, Architectures, Arrangements, and Applications (SPA), Poznań, DOI: 10.23919/SPA.2018.8563388.
- (Woźniak 2017) T. Woźniak, M. Strzelecki, A. Majos, L. Stefańczyk, 3D vascular tree segmentation using a multiscale vesselness function and a level set approach, Biocybernetics and Biomedical Engineering 37, 2017, pp. 66-77, https://doi.org/10.1016/j.bbe.2016.11.003.