Geometric modeling of blood vessels
Introduction
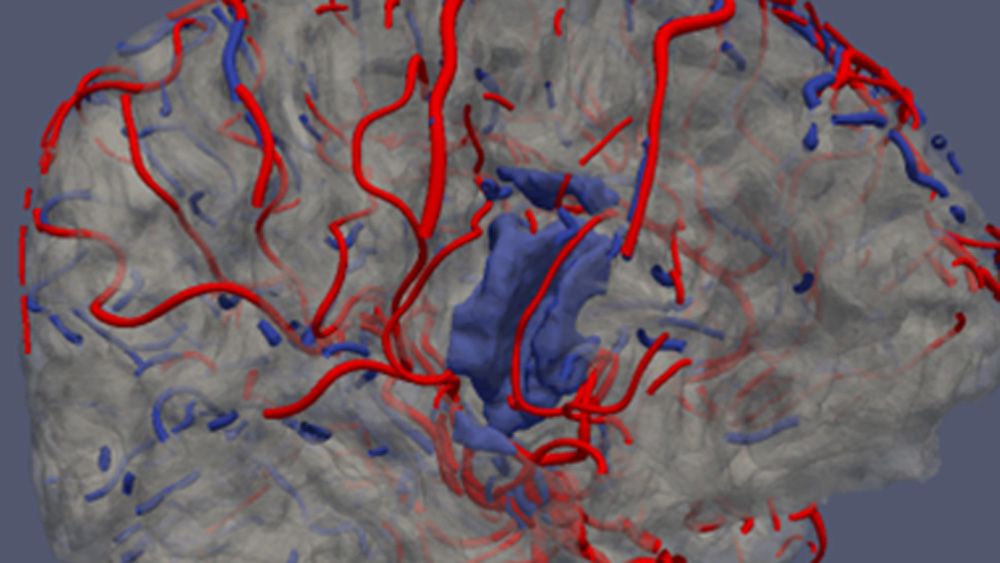
Cardiovascular diseases are the leading cause of death worldwide. Their prevention and treatment require accurate, noninvasive and personalized diagnostic techniques. At present, the leading technique is magnetic resonance (MR) tomography. It allows acquisition of three-dimensional images of blood filling the vessels and tissues, without use of contrast agents or X-ray radiation. Despite huge, still unexplored capabilities of this method, images accessible in clinics consist of elementary cuboids (voxels) of finite dimensions, e. g. 0,5x0,5x0,5 mm3. The intensity of each voxel is constant within its space, e. g. proportional to the amount of blood filling it. On the other hand, the diameter of the blood vessel branches takes values from a few centimeters for aorta (macroscopic scale) down to tens of micrometers for venules and arterioles (mesoscopic scale). The radius of most arteries and veins is comparable then to the length of voxel sides. This leads to the effect of voxelization – vessel regions are approximated by sets of cuboids (boxes). Smooth boundaries between the vessel and surrounding tissues take unnatural form of staircase surfaces. There is a need for development of algorithms for reconstruction of the original shape and dimensions of blood vessels for medical diagnosis, through numerical analysis of their severely distorted (due to the limited resolution) images. Moreover, the MR images feature random intensity fluctuations which are an additional source of uncertainty in finding the course of centerlines and measuring the diameter of vessels. The modeling algorithms should be robust to those (and other) distortions and noise, inherent to MR tomography. Comprehensive modelling of the processes of blood delivery to tissues has to account for the fact thin branches, of diameter smaller than the voxel side, are not visible in the image as separate regions, one can observe the net effect of their perfusion with blood only.
The project is aimed at development of mathematical description of the structure of blood vessels visualized in 3D magnetic resonance images. Such models offer objective, accurate geometrical information on the blood vessel trees and parameters of their branches – for detailed, personalized diagnosis of the circulatory system. They can be used for noninvasive simulation of blood flow, e. g. in critical regions such as stenoses and aneurysms. Geometric modeling allows for construction of vascular prostheses, e. g. via 3D printing, to restore patency of diseased branches.
")